Key takeaways
- From FY 2005 through FY 2025, WTI and U.S. federal oil royalty receipts moved in the same direction in 16 of 21 annual comparisons. Henry Hub and federal gas royalty receipts moved in the same direction in 17 of 21. Each price is an equal-weight average of 12 EIA monthly spot prices. Receipts use the corresponding signed ONRR commodity rows.
- The correlation between WTI and federal Oil commodity royalties was 0.539 across 22 fiscal-year levels and 0.841 across 21 adjacent fiscal-year percentage changes. Pearson correlation, FY 2004 through FY 2025 levels and FY 2005 through FY 2025 changes.
- The correlation between Henry Hub and federal Gas commodity royalties was 0.931 across 22 fiscal-year levels and 0.832 across 21 adjacent fiscal-year percentage changes. The Gas commodity subtotal excludes the separate Natural gas liquids category.
- From FY 2022 to FY 2023, average Henry Hub fell by 47.98%, while recorded federal Gas commodity royalties rose by 17.94%. The first percentage compares EIA spot benchmarks. The second compares signed ONRR fiscal receipts.
- Federal Oil commodity royalties rose in all 11 fiscal-year comparisons in which WTI rose, and fell in 5 of 10 comparisons in which WTI fell, from FY 2005 through FY 2025. The price uses EIA’s 12 monthly WTI spot observations per fiscal year. The receipt series uses signed federal ONRR Oil commodity royalties.
- Federal Gas commodity royalties rose in 9 of 10 fiscal-year comparisons in which Henry Hub rose, and fell in 8 of 11 comparisons in which Henry Hub fell, from FY 2005 through FY 2025. The benchmark is the equal-weight average of 12 monthly EIA Henry Hub spot prices. Each annual comparison is classified by the signs of the price and royalty changes.

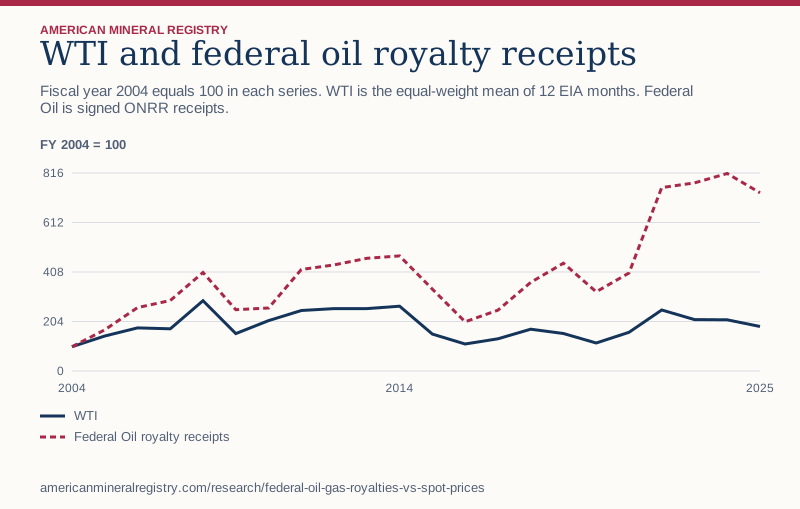
Figure 1 in text
Fiscal year 2004 equals 100 in each series. WTI is the equal-weight mean of 12 EIA months. Federal Oil is signed ONRR receipts. FY 2004 = 100.
| Federal fiscal year | WTI | Federal Oil royalty receipts |
|---|---|---|
| 2004 | 100.00 | 100.00 |
| 2005 | 144.13 | 169.65 |
| 2006 | 177.64 | 261.24 |
| 2007 | 173.88 | 290.55 |
| 2008 | 289.70 | 406.01 |
| 2009 | 153.97 | 252.75 |
| 2010 | 207.54 | 259.62 |
| 2011 | 249.27 | 418.50 |
| 2012 | 257.28 | 437.24 |
| 2013 | 257.11 | 464.35 |
| 2014 | 267.19 | 474.41 |
| 2015 | 151.99 | 337.03 |
| 2016 | 111.25 | 202.71 |
| 2017 | 132.72 | 250.62 |
| 2018 | 172.23 | 365.33 |
| 2019 | 154.75 | 444.40 |
| 2020 | 115.30 | 326.35 |
| 2021 | 159.39 | 403.69 |
| 2022 | 251.44 | 756.01 |
| 2023 | 211.83 | 775.14 |
| 2024 | 211.16 | 814.11 |
| 2025 | 183.56 | 734.38 |
Chart wording and scale
WTI and federal oil royalty receipts Fiscal year 2004 equals 100 in each series. WTI is the equal-weight mean of 12 EIA months. Federal Oil is signed ONRR receipts.
FY 2004 = 100 0 204 408 612 816 2004 2014 2025 WTI Federal Oil royalty receipts
Source and data: Download chart source data
Permanent link to this figure’s text and data · Sources and context
Which royalty dollars are paired with which market prices?
Pair the federal Oil commodity subtotal with the Cushing West Texas Intermediate spot benchmark and the federal Gas commodity subtotal with Henry Hub. The EIA WTI and spot-price definitions describes WTI as a marker used in pricing other crude streams. The EIA Henry Hub monthly history reports dollars per million British thermal units. The two price columns have different units and describe market references at specified locations.
The DOI fiscal revenue coverage and metadata distinguishes commodity and product information. The receipt filter uses Land Class = Federal, Mineral Lease Type = Oil & Gas and Revenue Type = Royalties. It then selects Commodity = Oil or Gas. These groups include the products that ONRR assigned to each commodity. Separate commodity rows, including Natural gas liquids, stay outside both groups. This is a federal onshore and offshore source receipt comparison.
How do you align a monthly price with a federal fiscal year?
The Federal Treasury fiscal-year calendar places the fiscal window from October through September. For FY 2025, take October, November and December of 2024, then January through September of 2025. Use the EIA monthly spot observations for each benchmark and give every month an equal weight. This method differs from an average weighted by daily observation count, barrels, gas volumes or individual lease sales.
In FY 2025 the resulting WTI mean was $68.22 per barrel and the Henry Hub mean was $3.20 per MMBtu. The download includes each window’s first and last month and the count of matched months. FY 2026 is outside the study because the frozen price file ends in December 2025, leaving nine months of the FY 2026 window outside this vintage. The separate ONRR receipt snapshot extends farther.
What do selected fiscal-year price levels and receipt totals look like?
The table includes the first year in the matched series, the FY 2008 market comparison, the FY 2022 and FY 2023 pair used later, and the most recent complete matched year. Each row shows two fiscal price averages and two signed federal revenue amounts. To reproduce a full trend or chart, use all 22 fiscal rows in the data download.
A price level and a receipt level serve different purposes. The market level can answer how high the reference price was during the fiscal window. The receipt level can answer how many dollars ONRR recorded for a commodity. A high value in one column does not require the highest value in the other. Keep the price units and receipt units in separate headers when reusing this comparison.
| Fiscal year | Mean WTI, USD per barrel | Mean Henry Hub, USD per MMBtu | Federal Oil royalties | Federal Gas royalties |
|---|---|---|---|---|
| 2004 | $37.17 | $5.58 | $1,484,650,843.61 | $4,569,319,631.88 |
| 2008 | $107.67 | $9.00 | $6,027,772,030.58 | $5,533,066,694.32 |
| 2022 | $93.45 | $6.22 | $11,224,056,397.85 | $2,098,276,722.65 |
| 2023 | $78.73 | $3.24 | $11,508,138,626.60 | $2,474,620,236.00 |
| 2025 | $68.22 | $3.20 | $10,902,996,602.66 | $979,015,053.00 |
How often did prices and recorded receipts move the same way?
Start with FY 2005 because an annual change needs a prior observation. Subtract the previous year from each series and divide by that previous year’s value. A same-direction comparison requires both changes to be positive or both to be negative. There were no zero changes in these matched pairs. The same-direction counts answer how often the signs agreed, without giving a large movement more weight than a small one.
The two correlation columns answer a different question. Pearson correlation on levels compares how high or low the annual amounts were together. Pearson correlation on annual percentage changes measures linear association between the two sets of changes. The denominator for the change sample is 21 because 22 levels give 21 adjacent pairs. A single percentage cannot replace the correlation or the direction count.
| Matched pair | Level observations | Level correlation | Change pairs | Change correlation | Same direction | Opposite direction |
|---|---|---|---|---|---|---|
| WTI and Oil royalties | 22 | 0.539 | 21 | 0.841 | 16 | 5 |
| Henry Hub and Gas royalties | 22 | 0.931 | 21 | 0.832 | 17 | 4 |
How do you reproduce a year when prices and receipts moved apart?
Take the Henry Hub mean of $6.22 in FY 2022 and compare it with $3.24 in FY 2023. The percentage change uses the unrounded FY 2022 price average as the denominator. Separately, compare FY 2023 Gas royalty receipts with the FY 2022 Gas royalty amount. Use the earlier royalty amount as the dollar-series denominator.
The FY 2022 to FY 2023 comparisons show opposite directions for both commodities. They are a useful check on a spreadsheet. If both sign flags are shown as same-direction, examine the year join, order of subtraction and scope of the royalty series. If a recalculation is only slightly different, inspect the precision of the price averages before rounding the final percentages.
| Matched commodity | FY 2022 benchmark | FY 2023 benchmark | Benchmark change | FY 2022 receipts | FY 2023 receipts | Receipt change |
|---|---|---|---|---|---|---|
| Oil and WTI, USD per barrel | $93.45 | $78.73 | -15.75% | $11,224,056,397.85 | $11,508,138,626.60 | 2.53% |
| Gas and Henry Hub, USD per MMBtu | $6.22 | $3.24 | -47.98% | $2,098,276,722.65 | $2,474,620,236.00 | 17.94% |
Can a benchmark price explain or predict federal royalty receipts?
The GAO report on federal oil and gas royalty reporting discusses multiple components that matter to royalty calculation, including sale prices, volumes, deductions and royalty rates. The EIA spot price in this study is a benchmark. It is not the sale price reported for every federal lease. The ONRR fiscal total records receipts within an accounting window. A market benchmark averaged over the same months does not establish which production period or sale corresponds to every receipt.
The comparison is descriptive. It does not isolate the effect of prices on revenues, adjust for changes in production or lease composition, or establish a forecasting relationship. To estimate a price effect, an analyst would need compatible valuation, volume, timing and lease information and a design that separates those influences. For a headline, report the observed direction count or correlation with the time window and exact commodity scope.
What should a reviewer verify before quoting the study?
Verify the input series and the fiscal calendar. The EIA Cushing WTI series and units gives the WTI series label and units. The calculation uses the matching monthly series from EIA and aligns it with monthly Henry Hub prices. Check for exactly one observation per benchmark for each of the 12 required months. Exclude an incomplete fiscal year from both price comparisons.
Verify the matching receipts separately. Sum signed federal fiscal royalties for the specified commodity and retain the full dollar precision. Rebuild the annual levels, then compute changes from adjacent pairs only. To reproduce Pearson correlation, center both series at their means, divide the sum of paired products of the centered values by the square root of the product of their sums of squares, and repeat on the percentage changes. Cite the level and change sample sizes separately.
How often did receipts follow rising and falling benchmarks?
The overall same-direction count combines price increases and price decreases. To see how agreement differs, first divide the comparisons according to the sign of the benchmark change. Within each price direction, count how often the royalty change had the same sign. Every row uses the number of changes of that price direction as its denominator, regardless of how large those changes were.
WTI’s 11 rising comparisons all coincided with higher Oil royalties. Of its 10 falling comparisons, five coincided with lower Oil royalties and five with higher receipts. Henry Hub also agreed more often in rising years than falling years in this series. Because there were no zero changes, each benchmark has 21 comparisons divided between the two direction rows.
The count is conditional on the price move observed in the selected fiscal years. It describes those records and does not estimate the probability that royalties will follow a future price move.
| Matched pair | Benchmark direction | Comparisons with that price direction | Royalty receipts rose | Royalty receipts fell |
|---|---|---|---|---|
| WTI and Oil royalties | Rose | 11 | 11 | 0 |
| WTI and Oil royalties | Fell | 10 | 5 | 5 |
| Henry Hub and Gas royalties | Rose | 10 | 9 | 1 |
| Henry Hub and Gas royalties | Fell | 11 | 3 | 8 |
How does direction agreement compare across earlier and later fiscal years?
Split the changes into those ending in FY 2005 through FY 2014 and those ending in FY 2015 through FY 2025. The earlier interval has 10 changes and the later interval has 11. The change ending in FY 2015 uses FY 2014 as its starting observation and belongs to the later interval only. The split is descriptive and does not identify a break in the underlying relationship.
WTI and Oil royalties agree in eight changes in each interval. The same raw count represents a different fraction because the denominators are 10 and 11. Henry Hub and Gas royalties agree in eight changes in the earlier interval and nine in the later interval. Report the raw count with its denominator instead of rounding both results into a generic statement about consistency.
A period may contain more falling benchmark years than rising benchmark years. Since the two directions have different agreement counts, overall agreement can move as the price-direction mix changes. The table keeps all four possible sign pairings visible.
| Change ending fiscal years | Matched pair | Both rose | Price rose and receipts fell | Price fell and receipts rose | Both fell | All changes |
|---|---|---|---|---|---|---|
| FY 2005 to 2014 | WTI and Oil royalties | 7 | 0 | 2 | 1 | 10 |
| FY 2005 to 2014 | Henry Hub and Gas royalties | 5 | 1 | 1 | 3 | 10 |
| FY 2015 to 2025 | WTI and Oil royalties | 4 | 0 | 3 | 4 | 11 |
| FY 2015 to 2025 | Henry Hub and Gas royalties | 4 | 0 | 2 | 5 | 11 |
What do the FY 2010 and FY 2019 exceptions show?
In the change ending FY 2010, Henry Hub rose 1.25% while federal Gas commodity receipts fell 20.66%. This was the only comparison where a rising Henry Hub benchmark coincided with falling Gas receipts. The price denominator is the FY 2009 Henry Hub mean. The royalty denominator is the FY 2009 signed Gas receipt total.
In the change ending FY 2019, both benchmark prices fell and both receipt series rose. WTI fell 10.15% while Oil receipts rose 21.65%. Henry Hub fell 0.85% while Gas receipts rose 12.66%. These examples show why a directional summary cannot substitute for the actual receipt observation.
The annual percentages compare matched fiscal observations and should be calculated before rounding the display values. They establish how the recorded series moved. They do not resolve whether prices, volumes, valuation or the timing of receipts drove the difference.
| Ending fiscal year | Matched pair | Benchmark change | Royalty change |
|---|---|---|---|
| 2010 | Henry Hub and Gas royalties | 1.25% | -20.66% |
| 2019 | WTI and Oil royalties | -10.15% | 21.65% |
| 2019 | Henry Hub and Gas royalties | -0.85% | 12.66% |
How can a reader reproduce the directional analysis with a spreadsheet?
Sort the downloaded observations in fiscal-year order. Compute the change from the prior row separately for the price and receipt columns. The first level observation provides a starting value and cannot count as a change. Make a label for the price sign and a label for the receipt sign, then cross-tabulate them for each matched pair. Retain the same fiscal-year and commodity scope on every row.
As a check, add the two cells in which both signs agree. They should reproduce the overall agreement count for that matched pair. Add all four cells to reproduce the number of adjacent comparisons. The rising-price and falling-price rows should reconcile to the complete change sample, and the grouped-period counts should reconcile to the same overall tally.
The full-sample agreement fraction is a weighted combination of the agreement fractions in rising and falling benchmark years. The weights are the numbers of comparisons in those two groups. An unweighted average of the two percentages gives the groups equal weight even when their sample sizes differ.
This workflow counts directions. A correlation also uses the size of the changes. For a chart or quote, identify the benchmark, the source commodity category, the fiscal period and whether the result uses levels or changes.
How does this analysis compare with published sources?
This study draws on ONRR / DOI, U.S. Energy Information Administration, U.S. Energy Information Administration, U.S. Government Accountability Office, U.S. Government Publishing Office. The comparison below shows which questions each source answers and which calculations AMR adds.
| Publication | What it covers | Where the scope differs | How AMR uses it |
|---|---|---|---|
| ONRR / DOI | Defines the annual revenue table and its land, commodity and revenue-type scope. | The metadata does not align market benchmarks to the fiscal totals. | Use as primary scope for Oil and Gas royalty rows. |
| U.S. Energy Information Administration | Defines spot prices and WTI as a Cushing crude marker. | The definitions do not identify lease-specific realized prices. | Treat WTI as a benchmark. |
| U.S. Energy Information Administration | Monthly history reports Henry Hub in dollars per million Btu. | The published grid is by calendar month. | Rebuild equal-weight fiscal means from the matched 12 months. |
| U.S. Government Accountability Office | Describes reported commodity prices, volumes, deductions and royalty rates. | The review does not compute this fiscal benchmark association. | Explain why benchmark price alone does not determine receipt dollars. |
| U.S. Government Publishing Office | Treasury fiscal year begins in October and ends in September. | The provision supplies a calendar rather than market or royalty values. | Use to align the 12 benchmark months. |
How should you read the indexed price and receipt chart?
Each line divides its own fiscal-year observations by its FY 2004 value and multiplies by 100. The common scale helps compare relative moves in a price and a dollar total with different original units. The displayed index does not change which direction an annual move takes. Use the download for dollar levels and the change table for correlations on annual percentage changes.
Sources and data
- ONRR original fiscal-year revenue CSV
- DOI fiscal revenue coverage and metadata
- EIA monthly WTI spot prices
- EIA monthly Henry Hub spot prices
- EIA WTI and spot-price definitions
- EIA Cushing WTI series and units
- GAO report on federal oil and gas royalty reporting
- Federal Treasury fiscal-year calendar
Download the data (CSV) · Read the data dictionary. The AMR analysis and figures are licensed CC BY 4.0. Refer to the original issuers for their materials.