Key takeaways
- New Mexico first exceeded North Dakota in 2021 in the 2010–2025 EIA annual state production panel. The crossover compares complete calendar-year crude oil production rates in the same publication.
- New Mexico crude oil production increased by 1.282 million barrels per day from 2019 to 2025, equivalent to 96.6% of the national net increase in EIA’s annual field production series. The denominator is the change in the published U.S. annual rate, including federal offshore production.
- Outside Texas, New Mexico and North Dakota, the U.S. crude oil production rate declined by 0.341 million barrels per day from 2019 to 2025 in EIA’s annual series. Subtract the three states from the U.S. rate in each year, then subtract the starting residual from the ending residual.

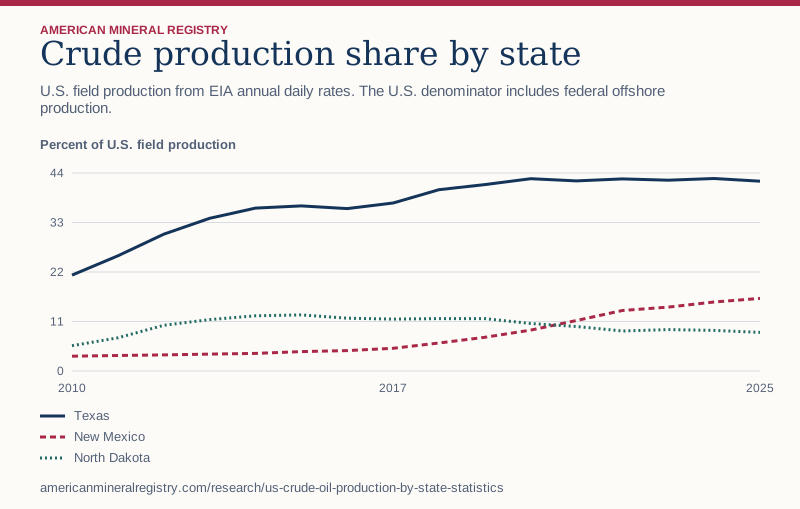
Figure 1 in text
U.S. field production from EIA annual daily rates. The U.S. denominator includes federal offshore production. Percent of U.S. field production.
| Calendar year | Texas | New Mexico | North Dakota |
|---|---|---|---|
| 2010 | 21.32 | 3.28 | 5.62 |
| 2011 | 25.59 | 3.45 | 7.37 |
| 2012 | 30.40 | 3.59 | 10.15 |
| 2013 | 33.93 | 3.76 | 11.42 |
| 2014 | 36.19 | 3.91 | 12.28 |
| 2015 | 36.68 | 4.30 | 12.48 |
| 2016 | 36.10 | 4.53 | 11.73 |
| 2017 | 37.34 | 5.04 | 11.54 |
| 2018 | 40.28 | 6.22 | 11.65 |
| 2019 | 41.42 | 7.48 | 11.65 |
| 2020 | 42.73 | 9.09 | 10.56 |
| 2021 | 42.25 | 11.22 | 9.90 |
| 2022 | 42.68 | 13.45 | 8.89 |
| 2023 | 42.41 | 14.20 | 9.20 |
| 2024 | 42.77 | 15.33 | 9.03 |
| 2025 | 42.17 | 16.14 | 8.57 |
Chart wording and scale
Crude production share by state U.S. field production from EIA annual daily rates. The U.S. denominator includes federal offshore production.
Percent of U.S. field production 0 11 22 33 44 2010 2017 2025 Texas New Mexico North Dakota
Source and data: Download chart source data
Permanent link to this figure’s text and data · Sources and context
Which states produce the most U.S. crude oil?
Texas, New Mexico and North Dakota were the three largest named state producers in EIA’s 2025 annual table. Their combined rate was 9.137 million barrels per day against 13.662 million nationally. The leading states table uses the national denominator, so its percentages remain comparable to the federal offshore figures discussed below.
Use the annual EIA crude production table to rank states. Rank the named state rows and keep the regional and federal offshore rows in a separate comparison. The combined state figures measure field production. If the question is what the states contributed to growth, compare changes in their rates. That gives a different percentage from the share of current output.
| 2025 rank | Named state | Million barrels per day | Share of U.S. |
|---|---|---|---|
| 1 | Texas | 5.761 | 42.2% |
| 2 | New Mexico | 2.205 | 16.1% |
| 3 | North Dakota | 1.171 | 8.6% |
| 4 | Colorado | 0.475 | 3.5% |
| 5 | Alaska | 0.422 | 3.1% |
How did the production mix change over time?
Hold the three names fixed to follow the same group through the full panel. Their combined share rose by 36.7 percentage points from 2010 through 2025. They are the leading 2025 states. The historical rows report their shares in those years regardless of rank at the time. A new top-three ranking each year would instead measure concentration among whoever led in that year.
Texas and New Mexico together show a different trajectory from North Dakota. The side-by-side table makes it possible to see whether the combined share changed because multiple state rates grew, one state became a larger part of the group, or U.S. production moved in the opposite direction. A share can fall during growth if the national denominator grows faster.
| Year | Texas share | New Mexico share | North Dakota share | Combined share |
|---|---|---|---|---|
| 2010 | 21.3% | 3.3% | 5.6% | 30.2% |
| 2014 | 36.2% | 3.9% | 12.3% | 52.4% |
| 2019 | 41.4% | 7.5% | 11.6% | 60.6% |
| 2020 | 42.7% | 9.1% | 10.6% | 62.4% |
| 2023 | 42.4% | 14.2% | 9.2% | 65.8% |
| 2025 | 42.2% | 16.1% | 8.6% | 66.9% |
Which states explain the change in the U.S. production rate?
The national annual-average rate grew by 8.178 million barrels per day between 2010 and 2025. Texas and New Mexico contributed 6.617 million of that increase. Adding North Dakota brings the three-state contribution to 7.480 million. The share of national net growth divides the change for a state or group by the change for the country.
This calculation is a volume-rate bridge. It holds the endpoints fixed and uses signed changes. A group’s contribution can exceed 100% of national net growth if other areas offset its increase. That is why the table carries a national residual for all areas outside the three states. The residual is an arithmetic difference from published U.S. production, and its sign can differ from any specific state outside the group.
The group did not move in lockstep during the 2019 to 2020 contraction. U.S. output fell by 0.986 million barrels per day. Texas fell by 0.260 million and North Dakota by 0.238 million, while New Mexico rose by 0.109 million. The opposing direction matters when attributing a national decline. Summing the three signed changes preserves New Mexico’s offset, while adding the absolute state movements would overstate the group’s contribution.
| Geography | 2010 million b/d | 2025 million b/d | Change, million b/d |
|---|---|---|---|
| Texas | 1.169 | 5.761 | 4.592 |
| New Mexico | 0.180 | 2.205 | 2.025 |
| North Dakota | 0.308 | 1.171 | 0.863 |
| All areas outside the three states | 3.827 | 4.525 | 0.698 |
| United States | 5.484 | 13.662 | 8.178 |
What does the New Mexico and North Dakota crossover show?
In 2021, New Mexico averaged 1.271 million barrels per day and North Dakota averaged 1.121 million. Before describing an annual crossover, check the prior full calendar year as well as the year in which the order changes. Using an individual month can move the date or produce a temporary crossover that disappears in the annual data.
State borders and oil-producing basins are different boundaries. EIA’s regional production analysis discusses the Permian across western Texas and southeastern New Mexico and the Bakken across North Dakota and Montana. The annual state rows cannot reproduce either basin total. A state’s growth cannot all be assigned to a single basin, formation or operator from these totals.
How do federal offshore barrels affect a state share?
EIA reports federal offshore Gulf and Pacific production separately from named states. Federal Gulf output was 1.942 million barrels per day in 2025. Adding it to a state’s reported output would distort the numerator. Excluding it from the national denominator would produce a share of a narrower population.
Federal Gulf output was larger in 2025 than in 2010, yet its national share declined by 14.1 percentage points. That is a useful distinction for supply reporting. A lower share can coexist with higher physical output. EIA’s state and federal offshore series supply both measures without assigning the offshore line to any state.
How do daily rates translate into an annual volume?
The Texas 2025 rate in the source is 5,761 thousand barrels per day. Divide by 1,000 to express it in million barrels per day, or multiply by 365 to estimate the calendar-year volume in thousand barrels. This produces approximately 2,102.765 million barrels. The calculation inherits the precision of the published daily rate. Use EIA’s annual thousand-barrel series for a more precise total.
For a share within one calendar year, the same number of days would multiply both numerator and denominator, so the factor cancels. For an aggregate covering multiple years, use the annual volumes or multiply each annual rate by that year’s day count first. Averaging state percentages across years gives each year equal weight, even when the physical volumes differ.
What counts as production and why can estimates differ?
EIA’s production definitions describe field volumes at custody transfer, adjusted for lease inventory changes and sediment or water. The crude series can include lease condensate, but it excludes liquids produced at natural gas processing plants. A state agency may publish crude oil and condensate separately, so compare the stated product coverage.
An annual record can also change when reports are revised. EIA’s explanation of state production estimates describes how filing delays and incomplete records can lead to differences between early state reports and EIA estimates. Match the time period, commodity definition and release before interpreting an apparent difference as a change in production.
How did the source of U.S. production growth change across the period?
Texas added 2.009 million barrels per day between 2010 and 2014, while New Mexico added 0.163 million. The ordering changed after 2019. From 2019 to 2025, New Mexico added 1.282 million barrels per day, almost double the Texas gain of 0.652 million. North Dakota’s annual rate was 0.266 million barrels per day lower at the later endpoint.
Use the same endpoint years in each numerator and in the national denominator. In the 2019 to 2025 comparison, New Mexico’s gain was equivalent to 96.6% of the national net increase. The ratio describes a change in daily production rates. The EIA annual production table supplies the state and national observations. The 2020 to 2025 row is an alternative baseline that overlaps the previous row. It should not be added to it.
| Endpoint years | U.S. change, million b/d | Texas change | New Mexico change | North Dakota change |
|---|---|---|---|---|
| 2010 to 2014 | +3.297 | +2.009 | +0.163 | +0.770 |
| 2014 to 2019 | +3.554 | +1.931 | +0.580 | +0.359 |
| 2019 to 2025 | +1.327 | +0.652 | +1.282 | -0.266 |
| 2020 to 2025 | +2.313 | +0.912 | +1.173 | -0.028 |
Which areas offset production growth after 2019?
The three-state changes added up to more than the net national increase from 2019 to 2025. That leaves a decline elsewhere, even though some of those areas grew. The table groups selected nonoverlapping areas and leaves a residual for the locations without an individual row in the bridge. The residual describes a change in the annual average rate. It does not imply that all its components moved together.
Federal Gulf and Pacific offshore together increased by 0.045 million barrels per day in this window. Colorado and Oklahoma together and Alaska and California together moved in the opposite direction. The annual EIA table reports state and federal offshore rows separately. The pairs are AMR calculations, so the grouping does not imply a shared basin or production mechanism. Include the positive and negative changes when reconciling the geographic bridge.
| Areas outside the fixed trio | 2019, million b/d | 2025, million b/d | Change, million b/d |
|---|---|---|---|
| Colorado and Oklahoma | 1.123 | 0.879 | -0.244 |
| Alaska and California | 0.894 | 0.710 | -0.184 |
| Federal Gulf and Pacific offshore | 1.910 | 1.955 | +0.045 |
| Remaining areas, by subtraction | 0.939 | 0.981 | +0.042 |
| All areas outside the three states | 4.866 | 4.525 | -0.341 |
How can a leading producer have a negative growth contribution?
North Dakota’s largest annual rate in this panel was 1.437 million barrels per day in 2019. Its 2025 rate of 1.171 million was 18.5% lower. North Dakota remained among the three largest named state producers in 2025 despite that decline from its panel high. A production rank describes a level. A change from a particular year describes direction and magnitude.
A claim about the fastest-growing producer needs to identify whether growth means the largest absolute gain or the highest percentage gain. The second metric can favor a small starting base. New Mexico’s absolute gain comes from subtracting two rates. Its percent growth divides that difference by New Mexico’s starting rate. Use the national change in the denominator only when asking how much of the country’s net increase the state’s gain represents.
Why does choosing the starting year change the story?
The national rate increased by 2.313 million barrels per day from 2020 to 2025, compared with 1.327 million from 2019 to 2025. The 2020 starting rate is lower. Both comparisons use the same ending year and a complete calendar-year basis. Give the earlier window for the change from before the contraction and the later window for the change from its lower baseline. The size of the increase cannot establish why producers changed output.
The table’s intervals have different lengths, so their changes also answer a different question from an average annual pace. To express a linear pace, divide the change in the daily rate by the elapsed years. To express a compound rate, divide the ending rate by the starting rate, take the elapsed-years root and subtract one. The first has rate-change units per year. The second is an annualized percentage. Keep the raw endpoints so a reader can reproduce either calculation.
Texas represented 60.9% of net U.S. rate growth in the 2010 to 2014 window and 49.1% in the 2019 to 2025 window. These shares compare Texas with the country in each period. A share that falls between windows can still accompany a large positive increase in the state’s absolute daily rate.
What would a reproducible geographic growth claim include?
Record the four observations needed for a contribution. These are the state’s beginning and ending rates and the national beginning and ending rates. Preserve the national offshore coverage and the state’s own boundary. If a source also lists regional rows, exclude any region that contains a state already counted. Rebuild each signed change separately and compare their sum with the published national change after including the residual.
When the U.S. change is close to zero, growth contributions can become very large or switch sign even if the changes in state rates are small. The barrels-per-day changes remain readable in that case. Report the starting and ending years and the state’s signed change alongside the national figure. This makes it possible to check whether a large contribution percentage reflects a substantial physical movement or a small net denominator.
How does this analysis compare with published sources?
This study draws on EIA, EIA, EIA. The comparison below shows which questions each source answers and which calculations AMR adds.
| Publication | What it covers | Where the scope differs | How AMR uses it |
|---|---|---|---|
| EIA | Annual rate by state and federal offshore geography. | No fixed-cohort concentration or growth contribution. | Calculate with a published U.S. denominator. |
| EIA | National production record and selected basin shares. | Producing regions cross state boundaries and have a different population. | Keep the basin context separate from the state panel. |
| EIA | Differences between EIA and state reports, product coverage and revisions. | Historical methodology explanation does not rank producing states. | Use to interpret comparability, not as a source of current shares. |
How can an editor rebuild the figures and check geographic coverage?
Open the Petroleum Navigator annual table. Select annual thousand barrels per day, then use the United States row as the denominator. The source panel retains each series ID and the full 2010–2025 observations. Check that you are reading a named state rather than a PADD or a subrow within a state.
The download lists selected state and offshore lines plus the remainder of the U.S. total. To recreate the remainder, subtract all selected lines from the published national rate. For the three-state bridge, subtract only those three states. Neither residual ranks individual producers. Keep the release basis with any update, since the archive may revise historical values.
Sources and data
- EIA annual crude oil production by state and federal offshore area
- EIA field production definitions and source notes
- EIA analysis of 2025 production and producing regions
- EIA explanation of revisions and state estimates
Download the data (CSV) · Read the data dictionary. The AMR analysis and figures are licensed CC BY 4.0. Refer to the original issuers for their materials.