Key takeaways
- In 2024, U.S. underground gas storage recorded 7.332 Tcf of combined injections and withdrawals, with only 4.648 Bcf of net withdrawals. Combined volume adds flows in both directions. Net withdrawals subtract injections from withdrawals.
- Of the five reviewed years, 2022 had the highest combined underground storage flows, 8.072 Tcf. The comparison adds annual injections and withdrawals. It does not measure capacity, inventory or unique molecules.
- U.S. December working gas fell by 18.148 Bcf from 2023 to 2024, compared with 4.648 Bcf of net underground withdrawals during 2024. The inventory and flow figures come from separate EIA series and identified releases. Their difference is not assigned to a single cause.
- U.S. working gas rose by 1,632.343 Bcf between the ends of March and October 2024. This is a change in two monthly stock observations. Gross injections during that period are a separate statistic.
- In the 2024 U.S. working-gas series, the largest month-end inventory decline was 844.301 Bcf in January and the largest rise was 360.728 Bcf in May. January compares December 2023 with January 2024. Each change is calculated from consecutive EIA month-end inventory observations.
- October through December 2024 had the highest average month-end U.S. working-gas inventory of the four quarters, 3,763.597 Bcf, even though stocks fell by 177.818 Bcf from September to December. The quarterly average weights its three month-end observations equally. The change compares the quarter-end stock with the previous quarter-end stock.

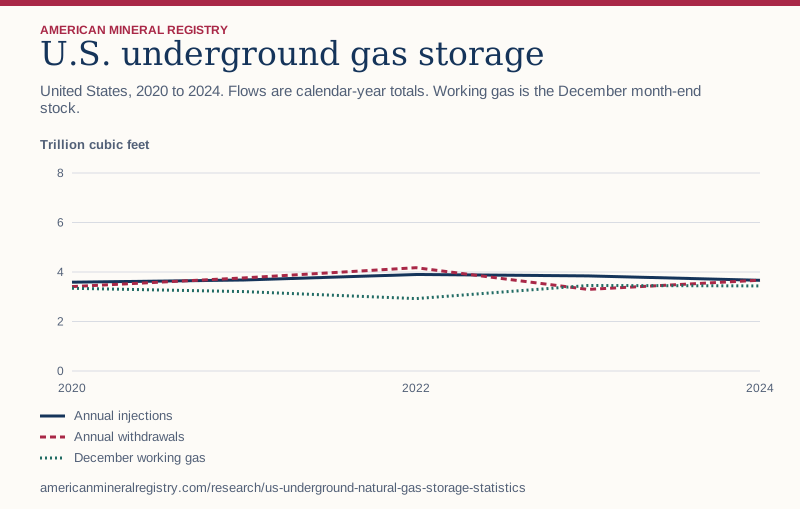
Figure 1 in text
United States, 2020 to 2024. Flows are calendar-year totals. Working gas is the December month-end stock. Trillion cubic feet.
| Calendar year | Annual injections | Annual withdrawals | December working gas |
|---|---|---|---|
| 2020 | 3.59 | 3.41 | 3.34 |
| 2021 | 3.68 | 3.76 | 3.21 |
| 2022 | 3.90 | 4.17 | 2.93 |
| 2023 | 3.84 | 3.30 | 3.46 |
| 2024 | 3.66 | 3.67 | 3.44 |
Chart wording and scale
U.S. underground gas storage United States, 2020 to 2024. Flows are calendar-year totals. Working gas is the December month-end stock.
Trillion cubic feet 0 2 4 6 8 2020 2022 2024 Annual injections Annual withdrawals December working gas
Source and data: Download chart source data
Permanent link to this figure’s text and data · Sources and context
How much gas went into and came out of U.S. underground storage?
The national annual figures count gas moved into and out of underground reservoirs during each calendar year. In 2024, injections and withdrawals were both above 3.600 Tcf. The difference was just 4,648 MMcf. A small net amount can therefore occur in a year with substantial movement in both directions.
The table reports net injections, calculated as injections minus withdrawals. A negative value means withdrawals exceeded injections. When EIA uses the term net withdrawals, it subtracts in the opposite order. Quote the sign along with the definition so the same year cannot be read as both a net build and a net draw.
| Year | Injections, Tcf | Withdrawals, Tcf | Net injections, Bcf | Combined flows, Tcf |
|---|---|---|---|---|
| 2020 | 3.590 | 3.412 | +177.885 | 7.002 |
| 2021 | 3.678 | 3.761 | -83.186 | 7.439 |
| 2022 | 3.898 | 4.175 | -276.818 | 8.072 |
| 2023 | 3.841 | 3.295 | +546.031 | 7.136 |
| 2024 | 3.664 | 3.668 | -4.648 | 7.332 |
Which year had the most movement through storage?
Adding injections and withdrawals gives 8.072 Tcf of combined movement in 2022, the largest amount in the five annual observations. That year also recorded the highest annual withdrawals in the sample. The largest net build was in 2023, when injections exceeded withdrawals by 546,031 MMcf. The peak net build and the peak combined flow answer different questions.
The same gas can enter and leave storage and be counted in both flow series. Adding them measures activity in both directions. It cannot tell a reader how many distinct units of gas were handled, how many times every field cycled, or the maximum volume that facilities could hold at one time.
How is working gas inventory different from net flow?
Working gas is the portion of stored gas available for withdrawal. The separate base or cushion inventory helps maintain reservoir pressure and deliverability. The monthly U.S. working-gas series reports 3,437,519 MMcf at the end of December 2024. It records a stock at a point in time. Annual injections and withdrawals measure movement over the year.
Inventory change uses two stock observations, current December less the preceding December. It can have a different magnitude from the net flow for the same year. The table pairs both figures for every year while preserving their original release dates in the download. The 2019 December observation is included in the CSV because the first annual comparison needs an opening stock.
| Year | December working gas, Tcf | Change from prior December, Bcf | Net injections, Bcf |
|---|---|---|---|
| 2020 | 3.341 | +152.738 | +177.885 |
| 2021 | 3.210 | -130.998 | -83.186 |
| 2022 | 2.925 | -284.602 | -276.818 |
| 2023 | 3.456 | +530.286 | +546.031 |
| 2024 | 3.438 | -18.148 | -4.648 |
How do I reconcile the 2024 figures without hiding the difference?
Subtract 3,668,387 MMcf of withdrawals from 3,663,739 MMcf of injections to get -4,648 MMcf of net injections. Separately, subtract the December 2023 working stock of 3,455,667 MMcf from the December 2024 stock of 3,437,519 MMcf. That gives -18,148 MMcf. The stock change minus net injections is -13,500 MMcf across the cited releases.
EIA warns that reported gas in storage at the end of a period can differ from the quantity implied by opening gas plus net flows. Its storage notes describe changes in native gas included as base gas and losses in base gas from migration. Its weekly methodology also discusses reclassifications. This study does not isolate the causes of the 2024 difference, and the source editions differ.
How much did inventory build within 2024?
The U.S. all-operator series recorded 2,306,056 MMcf of working gas at the end of March and 3,938,399 MMcf at the end of October 2024. The difference was 1,632,343 MMcf. Stocks then fell 500,880 MMcf from October to December. The December-to-December change leaves these substantial within-year movements out of view. For modeled household spending across warmer and colder winter cases, use the winter energy costs comparison.
The selected months demonstrate how a starting point affects a stock-change headline. The source CSV retains all twelve month-end observations for 2024. If the question asks how much was physically injected during those months, use the monthly injection series. Subtracting two stock readings gives an inventory change even when injections and withdrawals occurred in both directions during the interval.
| Selected month end, 2024 | U.S. working gas, Tcf |
|---|---|
| January | 2.611 |
| March | 2.306 |
| June | 3.175 |
| September | 3.615 |
| October | 3.938 |
| December | 3.438 |
Can individual states have opposite flow balances in the same year?
EIA’s state table shows that Texas and Louisiana added more gas to underground storage than they withdrew in 2024, while Michigan and Pennsylvania withdrew more than they injected. These are four selected state rows. Adding them would omit other storage states and could give a misleading national picture.
Use the underground columns when comparing these balances. The same EIA table also includes separate LNG storage additions and withdrawals. For example, Pennsylvania has both underground and LNG activity. The national total used throughout this study excludes LNG storage, so matching it requires keeping that column separate even if a local source reports both.
| State | Underground injections, MMcf | Underground withdrawals, MMcf | Net injections, MMcf |
|---|---|---|---|
| Louisiana | 486,306 | 465,180 | +21,126 |
| Michigan | 388,681 | 438,758 | -50,077 |
| Pennsylvania | 375,661 | 411,308 | -35,647 |
| Texas | 688,000 | 675,106 | +12,894 |
Which date belongs beside a weekly, monthly or annual figure?
EIA’s Weekly Natural Gas Storage Report estimates Lower 48 working gas using a sample of underground storage operators. The standard observation is a Friday morning stock and the standard publication time is the following Thursday morning, with holiday exceptions. A weekly release date describes when readers received the estimate, while the week-ending date describes when the gas was measured.
The monthly series used here covers U.S. underground working gas reported by operators, including Alaska. Its December month-end observations use the historical series as released October 30, 2026. The annual flows come from the Natural Gas Annual with data for 2024, released November 28, 2025. Those release dates are different from the month ends and calendar years shown in the tables.
What denominator belongs in a storage fullness comparison?
EIA’s annual capacity table reports 4,793,009 MMcf of working natural gas capacity and 9,319,291 MMcf of total underground capacity at the end of 2024. A national ratio of the December working inventory to the reported working-gas capacity is 71.7%. Dividing that same stock by total underground capacity would instead give 36.9%, because total capacity includes space for base gas.
The capacity table includes active and inactive fields. The national ratio therefore compares the two published aggregates. It does not establish how much inventory a trader can withdraw on a particular day or how much capacity is commercially available. Rate and availability questions require the relevant facility or market data.
Which 2024 months had the largest rise and fall in working gas?
The biggest decline between consecutive month ends was in January, down 844.301 Bcf from December 2023. The biggest increase was in May, up 360.728 Bcf from April. Each comparison uses the same national monthly working-gas series. January is included because the previous December stock is available in the download.
The table shows when the direction changed. Working gas declined in the first three comparisons, rose in each month from April through October, and declined in November and December. It also shows why a large inventory level and a large increase are different observations. October had the highest month-end level, while May recorded the largest month-end increase.
To copy a figure accurately, write that U.S. working-gas stocks rose by a given amount between two named month ends. Monthly stock change can include effects other than net movement through the facility. The monthly table supplies measured working-gas stock at each endpoint, so it cannot reveal gross injections or withdrawals, the timing of intramonth movements, or which facilities drove the change.
| Month in 2024 | Working-gas change from preceding month end, Bcf |
|---|---|
| January | −844.301 |
| February | −261.686 |
| March | −43.624 |
| April | +256.393 |
| May | +360.728 |
| June | +251.796 |
| July | +118.642 |
| August | +76.639 |
| September | +245.083 |
| October | +323.062 |
| November | −23.527 |
| December | −477.353 |
Can average inventory be high during a quarter with a net stock decline?
In the fourth quarter of 2024, the three observed month-end inventories averaged 3,763.597 Bcf. That was the highest quarterly average in this series for 2024. Nevertheless, working gas at the end of December was 177.818 Bcf below its September month-end level. The quarter started with a relatively high stock and included elevated October and November observations before the December drop.
The first column of values averages three month-end stocks equally. The second subtracts the previous quarter’s final stock from the current quarter’s final stock. A quarterly average describes the overall level of the three snapshots. The subtraction describes the direction and magnitude between boundaries. Neither number is a day-weighted average, and quarter length has no effect on the calculation.
Across all twelve month ends in 2024, the average working-gas stock was 3,124.808 Bcf. December’s level was 312.711 Bcf above that average. An article about how much gas was held at year-end should cite December’s actual observation. An article comparing typical month-end levels across years can use the same twelve-observation average for each year, with the averaging method stated.
| Quarter | Mean of three month-end stocks, Bcf | Change from prior quarter end, Bcf |
|---|---|---|
| January–March | 2,422.367 | −1,149.611 |
| April–June | 2,886.866 | +868.917 |
| July–September | 3,426.402 | +440.364 |
| October–December | 3,763.597 | −177.818 |
How does the annual net flow compare with activity in both directions?
To compare the scale of net flow across years, divide the absolute difference between injections and withdrawals by the sum of injections and withdrawals. This calculation treats a net draw and a net build the same when measuring their magnitude. Report the sign or the words build and draw separately. Otherwise a large net withdrawal could appear to rank below a small build for a purely arithmetic reason.
Among the five annual observations, 2023 had the highest ratio at 7.65%. The 2022 ratio was 3.43% even though that year had the largest combined flow volume. The years answer different questions. A high ratio means the annual inflow and outflow totals differed by more relative to their sum. It does not reveal whether storage facilities operated more intensely on individual days.
National values can also conceal offsetting local flows. In 2024, the Texas and Louisiana underground rows combined for 34,020 MMcf of net injections. Michigan and Pennsylvania together recorded 85,724 MMcf of net withdrawals. Those four state rows netted to a withdrawal of 51,704 MMcf. The published national net withdrawal was smaller because the other rows, together with any rounding, offset 47,056 MMcf. This is a subtraction against the national total and gives no evidence that gas physically moved between the selected states.
Did year-end working gas and annual net flows move in the same direction?
They did in each of the five comparisons. Both were positive in 2020 and 2023 and negative in 2021, 2022 and 2024. The magnitudes still differed. The largest absolute difference was in 2021. Annual net injections were negative 83.186 Bcf, while the December-to-December inventory change was negative 130.998 Bcf. Subtracting the first figure from the second gives a difference of negative 47.812 Bcf.
That agreement in direction is a check on this particular window, with its two stated source vintages. It does not make the two series interchangeable or establish a general rule about future years. For a study testing whether storage was a net source of gas, preserve the sign on the measured annual flows. For a comparison of working reserves on hand at two dates, use the two stock observations. State which quantity you compared if reporting that both declined.
How does this analysis compare with published sources?
This study draws on U.S. Energy Information Administration, U.S. Energy Information Administration, U.S. Energy Information Administration, U.S. Energy Information Administration, U.S. Energy Information Administration, U.S. Energy Information Administration. The comparison below shows which questions each source answers and which calculations AMR adds.
| Publication | What it covers | Where the scope differs | How AMR uses it |
|---|---|---|---|
| U.S. Energy Information Administration | Table 1 reports five calendar years of underground additions and withdrawals. | Annual flows alone do not show month-end working inventory. | Calculate gross and net annual activity and link a separate stock series. |
| U.S. Energy Information Administration | Table 12 reports 2024 state and national flows for underground and LNG storage. | State examples and different storage types cannot be combined into the national underground total. | Show opposing state flows and keep the underground column fixed. |
| U.S. Energy Information Administration | Monthly U.S. working gas in underground storage, in MMcf. | A stock level or difference does not reveal gross injections or withdrawals. | Compare December endpoints and selected 2024 months separately from flows. |
| U.S. Energy Information Administration | Defines base gas, working gas and net withdrawals and explains potential reconciliation limits. | The notes do not attribute the exact 2024 residual in this comparison. | Report the observed difference without assigning a cause. |
| U.S. Energy Information Administration | Explains Friday stock measurement, release timing and Lower 48 sampling. | The weekly survey does not share the monthly series' national geography or month-end observation date. | Teach the reader to match measurement date, coverage and publication date. |
| U.S. Energy Information Administration | Table 13 reports working gas capacity and total capacity, including inactive fields. | Capacity does not establish actual stock, rate or commercially available space. | Compare the working-gas stock against working capacity and label the denominator. |
Which storage statistic should an article cite?
For an amount of working gas on hand, specify the stock date, geography and reporting program. For movement into or out of reservoirs over time, use injections or withdrawals for the same period. If the question concerns the difference between those flows, state the sign convention. For physical space available, use working-gas capacity or design capacity with its own definition and date.
Keep volume units intact. One Bcf equals 1,000 MMcf and one Tcf equals 1,000 Bcf. Calculate at source precision before rounding a displayed figure. If updating the analysis, re-read the annual flow totals and both months used in each stock difference. A missing period cannot be filled with zero, and a late release can revise past observations.
Sources and data
- EIA Natural Gas Annual with data for 2024, Tables 1, 12 and 13
- EIA Natural Gas Annual release index
- EIA U.S. underground working gas, monthly series N5020US2
- EIA underground storage definitions and reconciliation notes
- EIA Weekly Natural Gas Storage Report
- EIA weekly underground storage estimates methodology
Download the data (CSV) · Read the data dictionary. The AMR analysis and figures are licensed CC BY 4.0. Refer to the original issuers for their materials.