Key takeaways
- U.S. refinery utilization rose from 78.9% in 2020 to 92.0% in 2025 while annual operable atmospheric distillation capacity fell by 0.482 million barrels per calendar day. EIA’s gross inputs increased by 2.008 million barrels per day over the same period.
- Across EIA’s 2000–2025 annual U.S. refinery panel, gross atmospheric distillation inputs peaked in 2018 at 17.316 million barrels per day. Operable capacity peaked in 2019. The peak years refer to the published annual operations series.
- In 2025 EIA reported 16.731 million barrels per day of U.S. gross atmospheric distillation inputs and 16.369 million barrels per day of refinery and blender net crude inputs. The reported rates differ by 362 thousand barrels per day across two distinct measures. The difference cannot identify a feedstock category.
- U.S. refinery gross atmospheric distillation input was 0.262 million barrels per day lower in 2025 than in 2019, while operable utilization was 1.6 percentage points higher. The annual operable capacity denominator was lower in 2025. The comparison uses EIA’s published annual values.
- In EIA’s 2000–2025 annual U.S. refinery panel, 15 of 26 years reached 90% utilization, while 6 of 26 met both that cutoff and gross distillation input of at least 16.500 million barrels per day. The thresholds use published annual utilization and gross atmospheric distillation input.
- U.S. gross distillation input was 2.073 million barrels per day below 90% of annual operable capacity in 2020 and 0.369 million barrels per day above it in 2025, using EIA’s annual refinery rates. Subtract 90% of same-year calendar-day operable capacity from observed gross input.

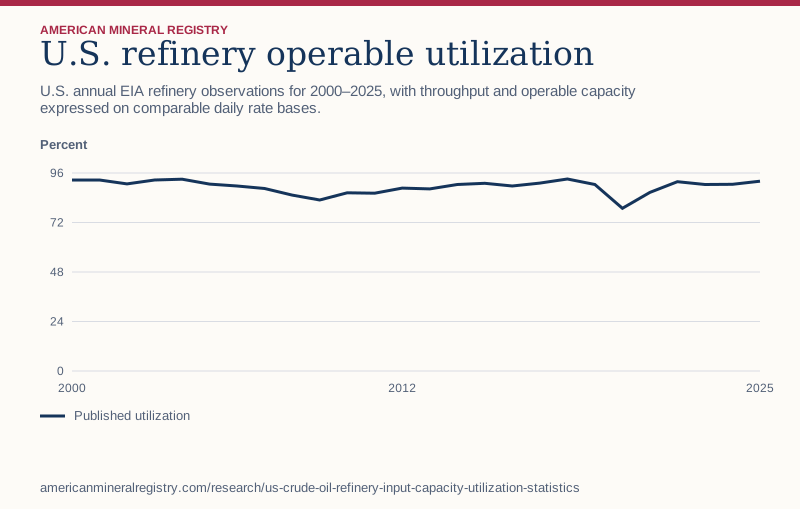
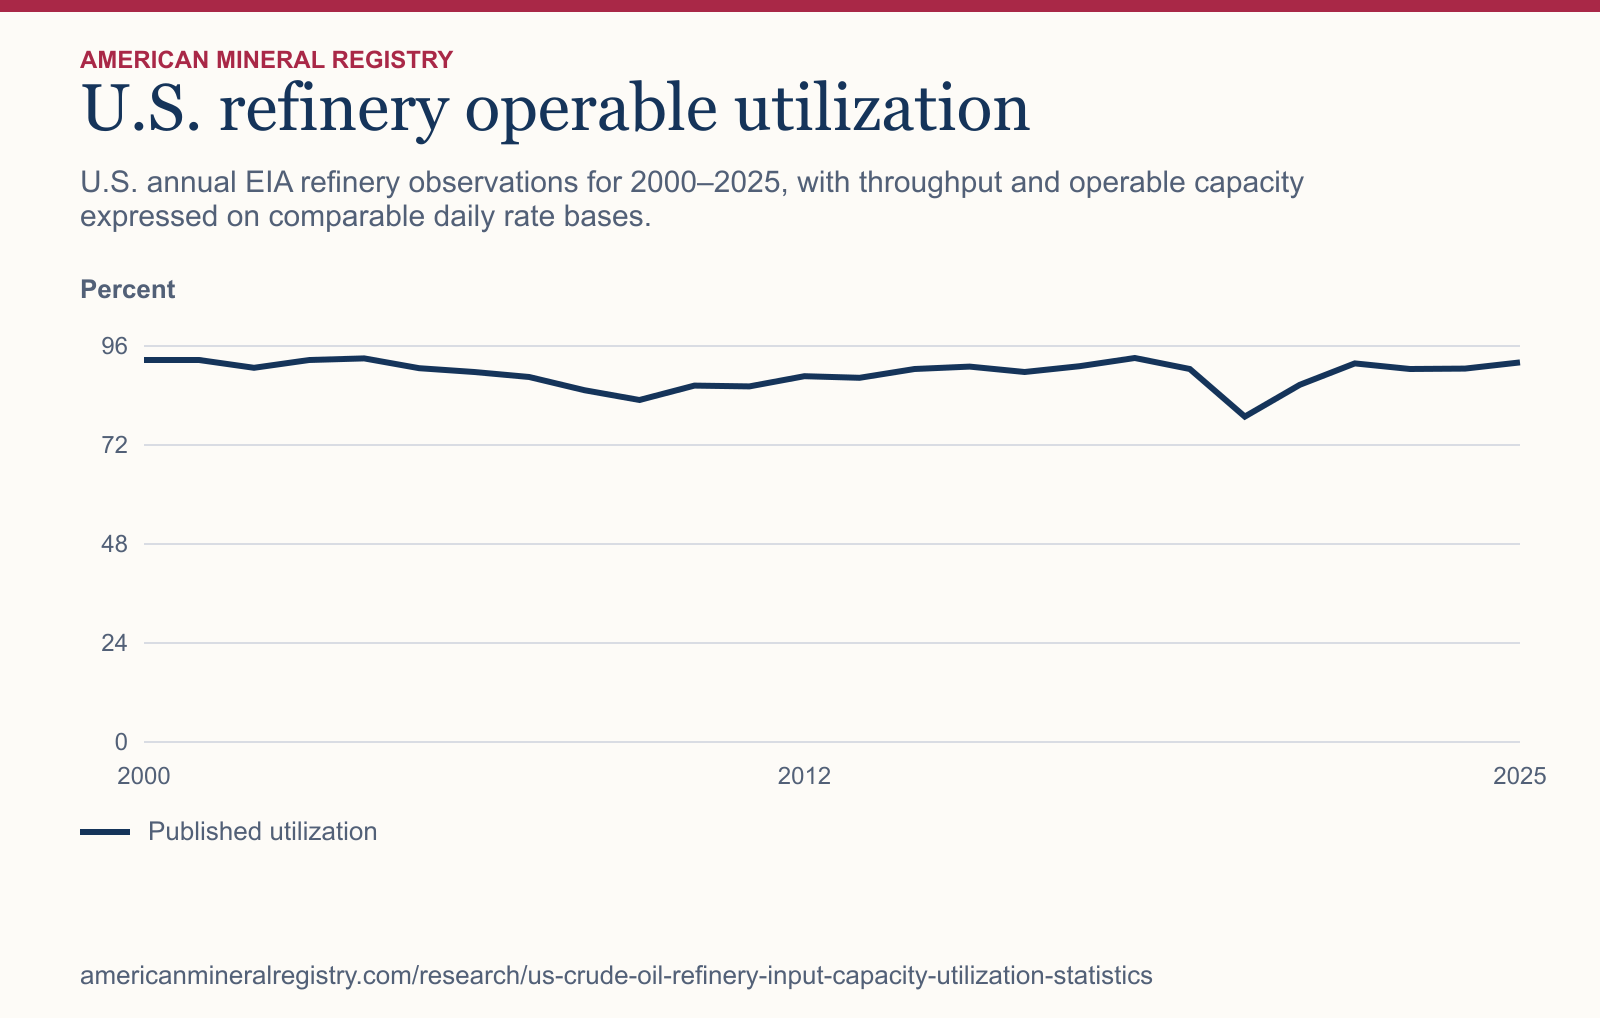
Figure 1 in text
U.S. annual EIA refinery observations for 2000–2025, with throughput and operable capacity expressed on comparable daily rate bases. Percent.
| Calendar year | Published utilization |
|---|---|
| 2000 | 92.60 |
| 2001 | 92.60 |
| 2002 | 90.70 |
| 2003 | 92.60 |
| 2004 | 93.00 |
| 2005 | 90.60 |
| 2006 | 89.70 |
| 2007 | 88.50 |
| 2008 | 85.30 |
| 2009 | 82.90 |
| 2010 | 86.40 |
| 2011 | 86.20 |
| 2012 | 88.70 |
| 2013 | 88.30 |
| 2014 | 90.40 |
| 2015 | 91.00 |
| 2016 | 89.70 |
| 2017 | 91.10 |
| 2018 | 93.10 |
| 2019 | 90.40 |
| 2020 | 78.90 |
| 2021 | 86.60 |
| 2022 | 91.80 |
| 2023 | 90.40 |
| 2024 | 90.50 |
| 2025 | 92.00 |
Chart wording and scale
U.S. refinery operable utilization U.S. annual EIA refinery observations for 2000–2025, with throughput and operable capacity expressed on comparable daily rate bases.
Percent 0 24 48 72 96 2000 2012 2025 Published utilization
Source and data: Download chart source data
Permanent link to this figure’s text and data · Sources and context
Which measure shows how busy U.S. refineries are?
Use operable utilization for the share of atmospheric crude distillation capacity in use, gross inputs for the rate going through those units, and refinery and blender net crude inputs for the crude feedstock measure. The 2025 annual figures were 92.0%, 16.731 million barrels per day and 16.369 million barrels per day, respectively. These series answer different operational questions.
The EIA definitions put gross atmospheric input in the numerator of utilization. This includes crude and other liquids entering the units. The denominator is operable atmospheric distillation capacity per calendar day. Distillation is one stage of refining, so national utilization is an indicator for these units. Finished gasoline, diesel or jet fuel volumes require their own published production series.
| 2025 statistic | Published value | Question it answers |
|---|---|---|
| Gross atmospheric distillation input | 16.731 million b/d | How much entered the distillation units? |
| Operable capacity | 18.180 million barrels per calendar day | What is the operable rate under normal conditions? |
| Operable utilization | 92.0% | What proportion of operable capacity was used? |
| Refinery and blender net crude input | 16.369 million b/d | What was the reported net input of crude oil? |
How are calendar-day capacity, stream-day capacity and idle units treated?
EIA’s operations table definitions distinguish capacity under usual operating conditions from stream-day capacity under optimal continuous operating conditions. Calendar-day capacity accounts for practical limitations such as maintenance and downstream constraints. The operable figure also includes qualifying idle capacity. It can therefore differ from capacity actually operating at a particular time.
The EIA Refinery Capacity Report provides refinery-level equipment and capacity snapshots as of January 1. The 2025 EIA capacity article likewise describes the January snapshot and facility changes. Keep the point-in-time basis when using those releases. The time series here uses the annual capacity series linked to EIA’s utilization table, which pairs with annual throughput.
What changed across the full annual record?
Gross input was highest in 2018 at 17.316 million barrels per day in this panel. Utilization was highest in 2018 at 93.1% and lowest in 2020 at 78.9%. Capacity reached its panel high in 2019. The timing shows how independently throughput, physical capacity and the ratio can move.
The endpoint years give a compact comparison. The download keeps all 26 annual observations, including years where levels moved in the opposite direction. Specify the comparison window if quoting any high or low. An annual record can conceal shorter disruptions or periods of greater throughput. Monthly data are a better basis for an outage or maintenance story.
| Calendar year | Gross inputs, million b/d | Operable capacity, million b/calendar day | Utilization | Net crude input, million b/d |
|---|---|---|---|---|
| 2000 | 15.299 | 16.525 | 92.6% | 15.067 |
| 2010 | 15.177 | 17.575 | 86.4% | 14.724 |
| 2018 | 17.316 | 18.600 | 93.1% | 16.969 |
| 2019 | 16.993 | 18.808 | 90.4% | 16.563 |
| 2020 | 14.723 | 18.662 | 78.9% | 14.212 |
| 2022 | 16.485 | 17.963 | 91.8% | 15.977 |
| 2025 | 16.731 | 18.180 | 92.0% | 16.369 |
How could utilization rise while throughput stayed below 2019?
In 2025 gross atmospheric inputs were 0.262 million barrels per day below 2019. Operable capacity declined by 0.628 million barrels per calendar day, so the throughput-to-capacity ratio still rose. The operating gap is calculated by subtracting the gross input rate from operable capacity.
That arithmetic gap was 3.939 million barrels per day in 2020 and 1.449 million in 2025. It measures the difference between two national rates and can be used to compare like observations. It does not establish that the remaining capacity can be called on in a specific region, at a specific plant or for any crude grade. Those questions require unit configuration and operating status.
| Period | Change in gross, million b/d | Change in capacity, million b/calendar day | Utilization change, points |
|---|---|---|---|
| 2019 to 2020 | -2.270 | -0.146 | -11.5 |
| 2020 to 2025 | 2.008 | -0.482 | +13.1 |
| 2019 to 2025 | -0.262 | -0.628 | +1.6 |
How do I calculate utilization from the published rates?
Divide the 2025 EIA gross input rate of 16,731 thousand barrels per day by the annual operable capacity of 18,180 thousand barrels per calendar day. Multiplying by 100 gives 92.030%. EIA publishes 92.0%. Report the published percentage when quoting the agency. A rate recreated from displayed values can differ slightly because the source fields are rounded.
If a second worksheet gives the same throughput as an annual barrel volume, convert it back to a rate before dividing. A 2025 total is divided by 365, while a 2024 total needs 366. Never average monthly percentages to recreate a national annual percentage unless you have independently established the annual aggregation method and weights. Begin with EIA’s annual operations table for an annual comparison.
Can the same utilization rate represent different volumes?
EIA published 90.4% utilization in both 2019 and 2023. Gross atmospheric inputs were 16.993 million barrels per day in 2019 and 16.502 million in 2023, a difference of 0.491 million barrels per day. The annual capacity denominator fell by 0.560 million barrels per calendar day. This is a direct case where the same published percentage accompanied a materially different amount of oil and other feedstocks entering atmospheric distillation units.
To separate the arithmetic roles of input and capacity, divide the observed 2025 gross rate by the 2019 capacity. At that fixed denominator, the result is 88.96%, compared with 92.03% using the 2025 capacity. The fixed denominator is an illustration using observed source values. It does not model how refiners would run under the earlier capacity configuration, and it assigns no causal contribution to individual plants. Both calculations use EIA’s annual operations table.
For a regional or multi-plant comparison, keep each gross input alongside its capacity. An unweighted mean of plant percentages gives a small facility and a large facility equal influence. To describe the utilization of their combined capacity, sum the gross input rates and divide by the sum of the comparable calendar-day capacities.
Why does net crude input differ from gross distillation input?
The annual gross measure and the annual refinery and blender net crude measure differ by 362 thousand barrels per day in 2025. The former records input to atmospheric units and covers several feedstocks. The latter isolates crude oil and applies the source’s net input accounting for refiners and blenders. A difference between series is not a measured volume of non-crude inputs.
Use the net crude input series to compare refinery and blender crude feedstock across years. Use the definition of gross atmospheric input when discussing utilization. Neither source quantifies how much U.S.-produced oil stayed in the country. Imports and inventory changes can also contribute to refinery receipts.
How often did high utilization coincide with high throughput?
Apply two explicit thresholds to EIA’s complete annual panel. The first is published utilization of 90.0% or higher. The second is gross atmospheric distillation input of 16.500 million barrels per day or higher. These analytical cutoffs are useful for testing whether a high ratio and a large volume tend to describe the same years. They carry no implication about plant efficiency or a regulatory standard.
Of 26 years, 15 met the utilization cutoff and 6 met both cutoffs. Six years met the utilization cutoff in 2000–2009, when none reached the volume cutoff. The EIA annual operations series supplies both fields. Match the series by year, count the years meeting each threshold, and calculate the intersection. The last column shows a typical difference between capacity and gross input within each period.
| Calendar years | Years covered | At least 90% utilized | At least 16.5 million b/d | Both cutoffs | Median capacity less gross, million b/d |
|---|---|---|---|---|---|
| 2000–2009 | 10 | 6 | 0 | 0 | 1.591 |
| 2010–2019 | 10 | 5 | 4 | 3 | 1.852 |
| 2020–2025 | 6 | 4 | 3 | 3 | 1.744 |
What would 90% utilization mean in barrels per day?
Multiply the annual calendar-day capacity by 0.90 to get the gross throughput associated with a 90% ratio. In 2020 the arithmetic target was 16.796 million barrels per day. Actual gross input was 2.073 million barrels per day below it. In 2025 actual gross input exceeded that year’s target by 0.369 million barrels per day. The target changes whenever the capacity denominator changes.
The signed difference measures the distance from the chosen ratio at observed capacity. It is separate from the gap to 100% of operable capacity. The comparison keeps EIA’s original annual operating rates fixed, so it cannot predict a change in refinery output after a capacity adjustment. Recalculate the target for each row, then subtract it from gross inputs and retain the sign.
| Year | Actual gross, million b/d | 90% of capacity, million b/d | Actual less benchmark, million b/d |
|---|---|---|---|
| 2000 | 15.299 | 14.872 | +0.426 |
| 2009 | 14.659 | 15.910 | -1.251 |
| 2018 | 17.316 | 16.740 | +0.576 |
| 2020 | 14.723 | 16.796 | -2.073 |
| 2022 | 16.485 | 16.167 | +0.318 |
| 2025 | 16.731 | 16.362 | +0.369 |
What does a typical annual capacity gap measure?
The median annual difference between capacity and gross input was 1.591 million barrels per day in 2000–2009, 1.852 million in 2010–2019 and 1.744 million in 2020–2025. Subtract gross input from capacity in each year, sort the gaps within the period, then take the central value or average the central two. The periods have different numbers of years and the median gives each annual observation equal weight.
EIA’s operable capacity definition includes qualifying idle capacity and uses usual calendar-day conditions. The national gap cannot identify which units were idle, down for maintenance, or constrained elsewhere in a refinery. It also combines facilities with different feedstock and product configurations. Compare matching district rates for a regional question and use specific operating records for a plant-level assessment.
How can rounding change which years pass a threshold?
The 2022 observation sits close to the volume cutoff. Gross input was 16.485 million barrels per day, and published utilization was 91.8%. The input displays as 16.5 at one decimal, which could make the observation appear to meet the volume cutoff. Use the published observation of 16,485 thousand barrels per day to keep the classification consistent with the stated threshold.
Compare the source values before rounding the display, and state whether the test includes values equal to the cutoff. A strict greater-than rule may give a different count. Keep units attached to the thresholds and retain the EIA utilization value when quoting its series. Changing from operable calendar-day capacity to stream-day capacity would change the ratio even if the measured gross input were identical.
How can an editor use the two thresholds to answer different market questions?
For a question about whether a large share of existing national capacity was in use, count years using the utilization cutoff alone. For a question about whether the country processed a large daily volume, count years using the input cutoff alone. The overlap answers whether both conditions held. The two tests describe a different population when a period has substantially lower national capacity or when the latest annual rate reflects capacity additions.
To compare periods of different lengths, divide each threshold count by its own number of years before describing frequency. The table leaves those denominators visible. A comparison of two percentages should keep the definitions and dates fixed, and it should identify whether it uses a frequency of years or a share of capacity. Neither kind of percentage is a measure of refining margin, product yield or the number of individual facilities operating above the cutoff.
The converse appears in 2016, the only year in the panel to reach the volume cutoff without reaching 90%. EIA reported 16.514 million barrels per day of gross input and 89.7% utilization. That observation belongs in a count of high-throughput years and stays out of a count requiring both conditions. The classification follows the two definitions applied to the same year’s original values.
How does this analysis compare with published sources?
This study draws on EIA, EIA, EIA. The comparison below shows which questions each source answers and which calculations AMR adds.
| Publication | What it covers | Where the scope differs | How AMR uses it |
|---|---|---|---|
| EIA | National annual operations and utilization series. | The displayed series alone do not separate net crude feedstock or compare fixed periods. | Reconcile utilization and add the separate annual net crude series. |
| EIA | Plant-level capacity and facility counts as of January 1. | A point-in-time capacity snapshot differs from the annual operating series. | Keep as a separate definition and cross-reference. |
| EIA | Capacity changes and facility composition in a January snapshot. | Single release and different basis from annual throughput. | Use the publication to clarify boundaries of comparison. |
Which EIA fields should an editor download?
In the annual table, take gross atmospheric inputs from MGIRIUS2, operable calendar-day capacity from MOCLEUS2 and published utilization from MOPUEUS2. Match by calendar year. In the separate net crude history, take MCRRIUS2 with the annual frequency. The CSV keeps the precise source URLs, source values and the recreated ratios.
The reproduction check compares the ratio of displayed daily rates to the published annual utilization within a small rounding tolerance. A stream-day capacity column or an operating-only column fails the definition before any arithmetic. The national panel can support an annual operational comparison. It cannot establish spare processing at a particular facility, and it does not predict product prices.
Sources and data
- EIA annual U.S. refinery utilization and capacity
- EIA annual refinery and blender net crude input
- EIA definitions of gross input, operable capacity and utilization
- EIA Refinery Capacity Report and January 1 snapshots
- EIA analysis of the January 2025 refinery capacity snapshot
Download the data (CSV) · Read the data dictionary. The AMR analysis and figures are licensed CC BY 4.0. Refer to the original issuers for their materials.