Key takeaways
- LNG accounted for 56.7% of U.S. natural gas exports by volume in 2024. The denominator includes pipeline, LNG and compressed natural gas. The LNG numerator includes EIA’s reported re-exports.
- LNG supplied 81.6% of the increase in U.S. natural gas export volumes from 2020 to 2024. Gross exports increased by 2.422 Tcf. The reported LNG component increased by 1.977 Tcf over the same period.
- Gross U.S. natural gas exports increased by 96,534 MMcf from 2023 to 2024, while net exports fell by 120,073 MMcf. Imports increased by 216,607 MMcf, more than the increase in gross exports.
- In 2024, the United States exported a net 2.342 Tcf by pipeline to Mexico and imported a net 2.131 Tcf by pipeline from Canada. The partner calculations use the pipeline rows for each country. The United States remained a net natural gas exporter overall.
- U.S. net pipeline exports narrowed to 42,289 MMcf in 2022, the smallest annual pipeline balance from 2020 through 2024. The figure subtracts published pipeline imports from published pipeline exports. Gross outbound pipeline volumes still exceeded 3 Tcf in 2022.
- Net LNG exports accounted for 93.4% of cumulative U.S. net natural gas exports from 2020 through 2024. AMR divided the sum of five annual LNG export-minus-import balances, 18,398,832 MMcf, by the five-year all-mode net export total of 19,704,557 MMcf.

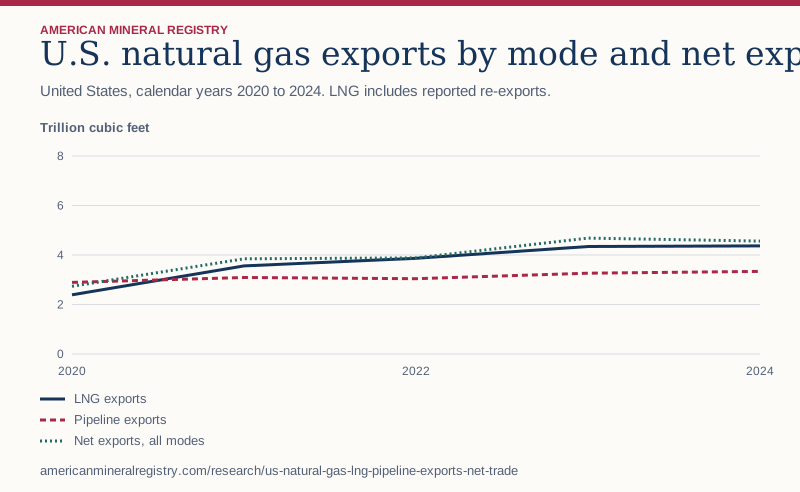
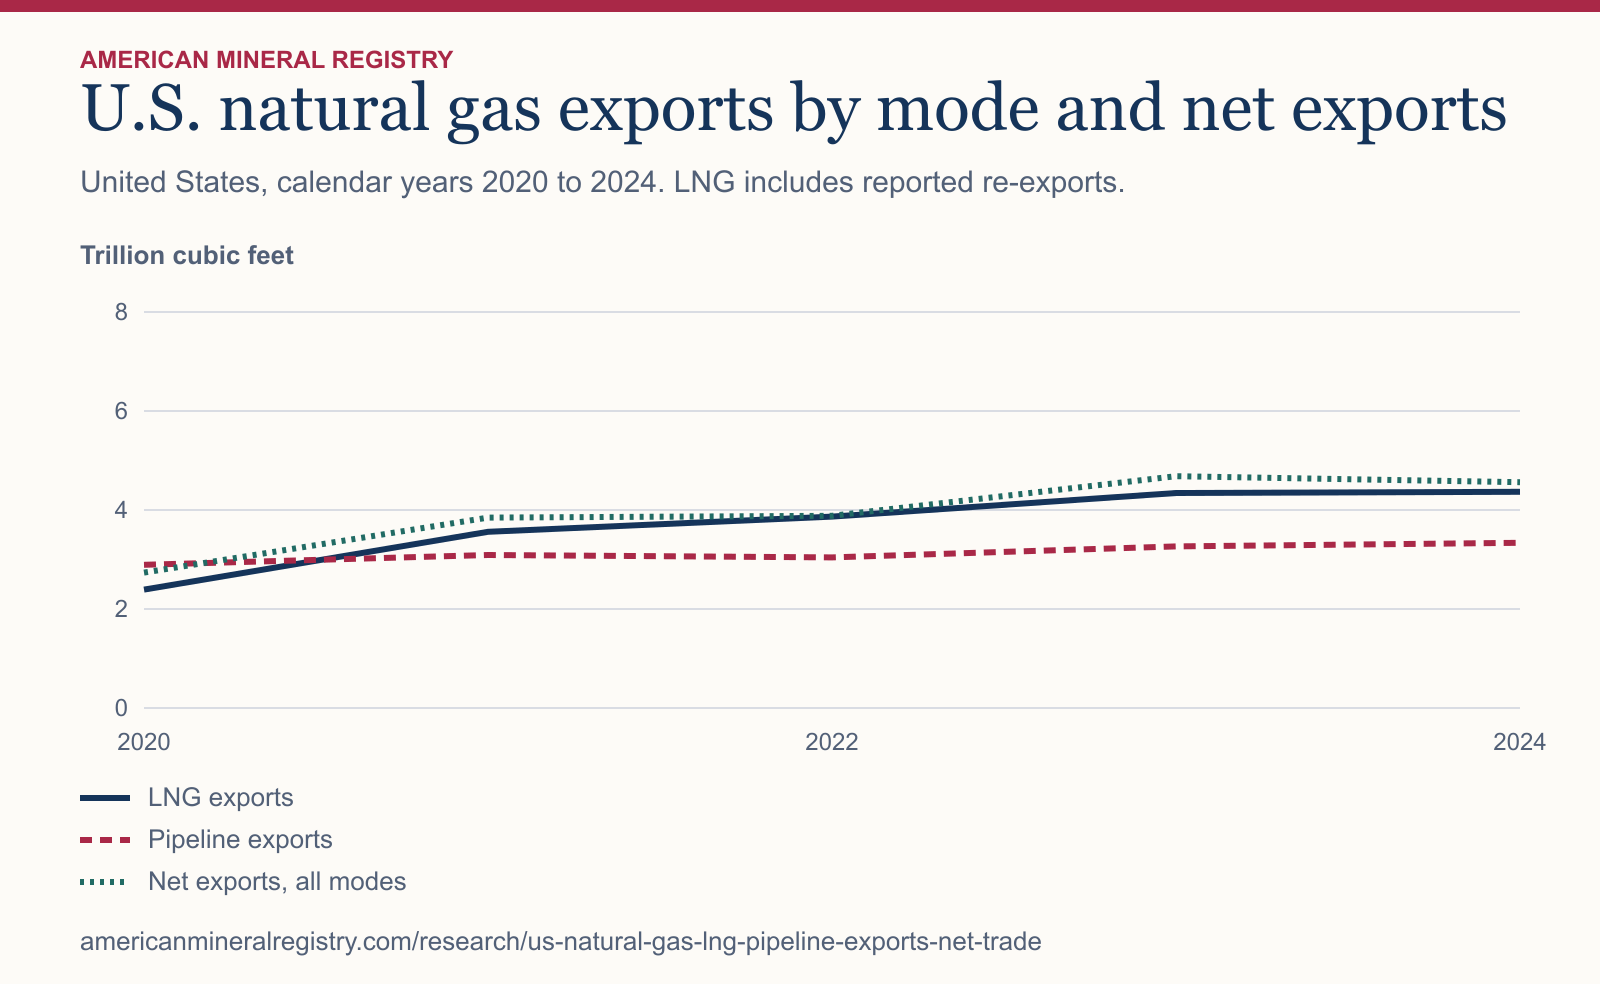
Figure 1 in text
United States, calendar years 2020 to 2024. LNG includes reported re-exports. Trillion cubic feet.
| Calendar year | LNG exports | Pipeline exports | Net exports, all modes |
|---|---|---|---|
| 2020 | 2.39 | 2.89 | 2.73 |
| 2021 | 3.56 | 3.09 | 3.84 |
| 2022 | 3.87 | 3.04 | 3.88 |
| 2023 | 4.34 | 3.27 | 4.68 |
| 2024 | 4.37 | 3.34 | 4.56 |
Chart wording and scale
U.S. natural gas exports by mode and net exports United States, calendar years 2020 to 2024. LNG includes reported re-exports.
Trillion cubic feet 0 2 4 6 8 2020 2022 2024 LNG exports Pipeline exports Net exports, all modes
Source and data: Download chart source data
Permanent link to this figure’s text and data · Sources and context
How did LNG, pipeline and total exports change from 2020 through 2024?
Pipeline exports exceeded LNG exports in 2020 in the five-year table. In 2021, the LNG row exceeded the pipeline row by 469,238 MMcf, and LNG remained the larger mode in each of the next three observations. That is a crossover within the selected window. An all-time claim would require a longer historical series and a check of EIA’s older reporting categories.
The annual series counts natural gas at the U.S. border in gas-volume units. An LNG volume in this table is comparable with a pipeline volume reported in the same units. A cargo’s tonnes of LNG, its liquid volume, and a terminal’s design capacity use different measurements and should be sourced separately.
| Year | Pipeline exports, Tcf | LNG exports, Tcf | CNG exports, MMcf | All exports, Tcf | LNG share |
|---|---|---|---|---|---|
| 2020 | 2.894 | 2.390 | 386 | 5.285 | 45.2% |
| 2021 | 3.092 | 3.561 | 211 | 6.653 | 53.5% |
| 2022 | 3.041 | 3.866 | 2 | 6.906 | 56.0% |
| 2023 | 3.267 | 4.343 | 446 | 7.610 | 57.1% |
| 2024 | 3.339 | 4.367 | 789 | 7.707 | 56.7% |
How much of the export increase came from LNG?
Compare the endpoints by subtracting 2020 from 2024 in each row. EIA reported a 2.422 Tcf increase in all natural gas exports and a 1.977 Tcf increase in LNG exports, giving LNG a 81.6% share of the total increase. Pipeline exports also rose, by 444,281 MMcf. CNG changed by 403 MMcf.
A growth contribution and a market share use different denominators. LNG supplied 81.6% of the increase between two years. Its share of the entire 2024 export volume was 56.7%. These are comparisons of reported volumes, and neither measures price, revenue or demand from any single buyer.
Why did net exports fall while gross exports rose?
Net exports are exports minus imports across the same period and modes. The U.S. total was 4.682 Tcf in 2023 and 4.562 Tcf in 2024. The change equals the increase in gross exports, 96,534 MMcf, minus the increase in imports, 216,607 MMcf. The larger import increase accounts for the lower net export volume.
Gross exports answer how much gas left the country as exports. Net exports answer how much larger exports were than imports after the two directions are combined. A reader can correctly report rising outbound volumes and falling net exports in the same year, provided the article says which measure each claim describes.
| Year | All exports, MMcf | All imports, MMcf | Net exports, MMcf |
|---|---|---|---|
| 2020 | 5,284,678 | 2,551,175 | 2,733,503 |
| 2021 | 6,652,609 | 2,807,961 | 3,844,648 |
| 2022 | 6,906,432 | 3,024,143 | 3,882,289 |
| 2023 | 7,610,034 | 2,927,939 | 4,682,095 |
| 2024 | 7,706,568 | 3,144,546 | 4,562,022 |
Can the United States be a net exporter and still import large volumes from Canada?
In 2024, the United States imported 3,127,280 MMcf by pipeline from Canada and exported 996,022 MMcf by pipeline to Canada. Mexico had the opposite trade balance with the United States. The U.S. pipeline export volume to Mexico was 70.2% of all U.S. pipeline exports.
The combined national pipeline balance was only 210,879 MMcf of net exports after imports, while net LNG exports were 4,350,689 MMcf. A pipeline export total counts all outbound pipeline trade. To describe the pipeline balance, subtract the corresponding pipeline import total. A partner balance can have the opposite sign to the national balance.
| 2024 flow | Exports, MMcf | Imports, MMcf | Net U.S. exports, MMcf |
|---|---|---|---|
| Pipeline, Canada | 996,022 | 3,127,280 | -2,131,258 |
| Pipeline, Mexico | 2,342,588 | 452 | 2,342,136 |
| All pipeline | 3,338,610 | 3,127,731 | 210,879 |
| All LNG | 4,367,170 | 16,481 | 4,350,689 |
| All CNG | 789 | 334 | 455 |
Which mode changed the U.S. trade balance between 2023 and 2024?
Pipeline imports increased by 215,383 MMcf, which accounted for 99.4% of the rise in all imports. Pipeline exports increased by 72,049 MMcf. The resulting decline in net pipeline exports was 143,334 MMcf. That decline was larger than the fall in all-mode net exports because the LNG balance moved in the opposite direction.
LNG net exports increased by 22,901 MMcf and the CNG balance increased by 361 MMcf. This is an accounting decomposition of the change. It tells a reader which measured streams offset one another. It does not identify why a buyer imported more gas or how much of the change was driven by prices, weather or domestic supply.
| Mode | Change in imports, MMcf | Change in net exports, MMcf |
|---|---|---|
| Pipeline | +215,383 | -143,334 |
| LNG | +1,242 | +22,901 |
| CNG | -18 | +361 |
Does the LNG export total mean the gas was produced in the United States?
EIA’s annual export table separates LNG exports from LNG re-exports, then includes the reported categories in its LNG total. Its annual chart also displays LNG re-exports separately and defines the narrower LNG series in the legend. Preserve those labels if you compare a chart with the trade table.
A volume leaving a U.S. point of export describes a trade flow. The mode and destination records do not identify the producing lease or assign the gas to a particular owner. Use a production source for a question about the gas extracted in the United States, and keep in-transit receipts and deliveries separate from the import and export totals used here.
How do I compare an annual total with a headline in Bcf per day?
The EIA table reports 4,367,170 MMcf of LNG exports in 2024. Divide by 1,000 to get 4,367.170 Bcf for the year. Divide again by 366 days to get 11.93 Bcf per day. EIA’s separate LNG article rounded its 2024 rate to 11.9 Bcf per day. Both the elapsed period and the volume definition matter.
For a non-leap year use 365 days. For a half-year comparison, use the actual days in that half-year and its corresponding volume. Do not add rounded rates from different periods to reconstruct a full-year total. A comparison of annual volumes can move differently from a comparison of average daily volumes when the years have different lengths.
How can I reproduce the 2024 net export calculation?
Use Tables 7 and 9 from the same annual edition. Subtract 3,144,546 MMcf of published imports from 7,706,568 MMcf of published exports to obtain 4,562,022 MMcf of net exports. Then subtract imports from exports separately in each mode. The mode-level results sum to 4,562,023 MMcf, one MMcf above the difference between the published totals.
EIA notes that components can differ from totals because it rounds them independently. The download retains the published totals and component values so a reader can see the residual. When the question is net trade for the country, use the published national totals. When the question is a trade mode, pair the published mode subtotals across directions.
How concentrated were U.S. natural gas imports by transport mode?
The export side had two large modes. The import side was much more concentrated. Rounded to two decimals, pipeline’s share of U.S. natural gas imports ranged from 98.06% to 99.47% across 2020 through 2024. LNG imports fell by 32,733 MMcf from 2020 to 2024 even as all-mode imports increased by 593,371 MMcf.
To reproduce the shares, divide each published import-mode subtotal by the published import total for that year. The table shows pipeline and LNG. The small omitted share is chiefly compressed natural gas. Independent rounding may also leave a small difference. A change in LNG imports cannot stand in for a change in all U.S. gas imports because pipeline volumes dominate the inbound denominator.
This is a description of measured imports at the national border. The import shares do not show how much of any region’s consumption depended on imports. That question needs a consumption denominator for the same area, plus data that connect those imports to the area where gas was used. A share of national imports is suitable for a trade-mode claim.
| Calendar year | Pipeline share of U.S. imports | LNG share of U.S. imports |
|---|---|---|
| 2020 | 98.06% | 1.93% |
| 2021 | 99.22% | 0.77% |
| 2022 | 99.15% | 0.84% |
| 2023 | 99.47% | 0.52% |
| 2024 | 99.47% | 0.52% |
Which year had the closest balance of U.S. pipeline imports and exports?
In 2022, national pipeline exports were 3,040,787 MMcf and pipeline imports were 2,998,498 MMcf. The difference was 42,289 MMcf, the narrowest positive pipeline balance in the five-year window. A small balance reflects the difference between substantial inbound and outbound volumes. It does not mean pipeline shipments were small.
The country lines explain what is being offset. In 2022, the net U.S. export balance with Mexico was 2,077,563 MMcf and the net U.S. import balance with Canada was 2,035,275 MMcf. Those two balances nearly canceled when combined. Their sum differs from the national pipeline balance by one MMcf. Use the national pipeline subtotals for the national subtraction and the country rows for each country subtraction.
The five-year table also helps test a trend claim. The net pipeline balance recovered from its 2022 low in 2023, then declined in 2024. It was lower in 2024 than in 2020. Describing the overall endpoint decline as an uninterrupted annual decline would misstate the intervening observations. Neither pattern identifies individual pipeline routes or explains the underlying demand.
| Year | Net U.S. pipeline exports to Canada, MMcf | Net U.S. pipeline exports to Mexico, MMcf | All pipeline net exports, MMcf |
|---|---|---|---|
| 2020 | −1,596,435 | +1,989,103 | +392,668 |
| 2021 | −1,847,314 | +2,152,739 | +305,424 |
| 2022 | −2,035,275 | +2,077,563 | +42,289 |
| 2023 | −1,886,353 | +2,240,567 | +354,213 |
| 2024 | −2,131,258 | +2,342,136 | +210,879 |
How much did LNG contribute to net trade across the entire window?
Summing the five annual published U.S. export totals gives 34,160,321 MMcf. The corresponding import sum is 14,455,764 MMcf. The difference is 19,704,557 MMcf in net exports for the five calendar years combined. LNG supplied 18,398,832 MMcf of the cumulative net balance. Pipeline net exports contributed 1,305,473 MMcf, and the CNG balance contributed 254 MMcf.
The component contributions add to two MMcf more than the cumulative all-mode balance because the individual published totals and components are rounded. This is a period total in volume units. Use it to describe how much gas the U.S. exported after subtracting imports over all five years. A daily average over the same interval would require dividing by the full number of elapsed days. An average of five separately rounded daily averages would answer a slightly different question.
The 93.4% LNG share comes from dividing cumulative net LNG exports by cumulative all-mode net exports. It is not the fraction of all gross exports shipped as LNG. A writer can use both figures in one article if each denominator is named. If the question is outbound shipping volume, use the gross mode shares. If it is which mode contributed most to the national trade balance, use the paired outbound-minus-inbound calculation.
How different can a mode’s share of gross exports and net trade be?
Use 2022 as a check. Pipeline accounted for 44.03% of U.S. gross natural gas exports that year, calculated as 3,040,787 MMcf divided by 6,906,432 MMcf. Pipeline contributed 1.09% of all-mode net exports, calculated as 42,289 MMcf divided by 3,882,289 MMcf. A large share of outbound shipments can coexist with a small share of the trade balance when inbound volumes are large.
For a story about how the U.S. moved exported gas, cite the first share. For a story about which mode contributed to net exports, cite the second. A reproducible comparison changes both the mode numerator and the national denominator together. Dividing net pipeline exports by all-mode gross exports would give a third ratio that mixes the two questions. If the all-mode balance is near zero, present the signed component volumes before attempting a share of that balance.
How does this analysis compare with published sources?
This study draws on U.S. Energy Information Administration, U.S. Energy Information Administration, U.S. Energy Information Administration, U.S. Energy Information Administration. The comparison below shows which questions each source answers and which calculations AMR adds.
| Publication | What it covers | Where the scope differs | How AMR uses it |
|---|---|---|---|
| U.S. Energy Information Administration | Annual U.S. import volumes by pipeline, LNG and CNG, with pipeline partner rows. | Does not supply a paired five-year net exports bridge. | Pair each published import subtotal with the matching export subtotal. |
| U.S. Energy Information Administration | Annual U.S. export volumes by mode and partner, including separate LNG re-export rows. | The table does not quantify mode contribution to total growth or reconcile gross with net. | Retain all three modes and compute both kinds of comparison. |
| U.S. Energy Information Administration | 2024 LNG daily rate and international destination context. | LNG-only framing does not compare all modes or U.S. net exports. | Show leap-year conversion of the annual LNG row as a cross-check. |
| U.S. Energy Information Administration | First-half 2024 net trade, pipeline directions and chart sign conventions. | A partial-year rate is not an annual balance. | Specify period and sign convention before comparing results. |
Which trade figure should an article cite?
For a national outbound-volume claim, cite all-mode gross exports. For a comparison of LNG with pipeline shipments, cite the two published mode subtotals or calculate their shares using all-mode exports as the denominator. For a balance-of-trade claim, state the subtraction convention. Some EIA regional trade charts use imports minus exports and describe a net export as a negative number.
The frozen sample uses the Natural Gas Annual with data for 2024, released November 28, 2025. The same EIA website also carries monthly and half-year articles that may use a different release or period. If refreshing the comparison, replace both directions from the same release and recheck component totals before substituting a new year.
Sources and data
- EIA Natural Gas Annual with data for 2024, Tables 7 and 9 and Figure 7
- EIA Natural Gas Annual release index
- EIA calendar 2024 LNG export rate
- EIA first-half 2024 net trade and chart conventions
Download the data (CSV) · Read the data dictionary. The AMR analysis and figures are licensed CC BY 4.0. Refer to the original issuers for their materials.